TokTrak Help Guide
Dashboard Overview
The Dashboard provides a high-level view of your TikTok video performance.
Key Features:
- Date Range Selection: Select a specific time period to analyze performance
- Export: Download your data for offline analysis
- Profile Selection: Choose a specific profile to analyze using the dropdown menu
Overall Visibility Graph
The visibility graph displays your TikTok ranking performance over time, showing how your position has changed for monitored keywords. Lower numbers indicate better rankings (with #1 being the top position).
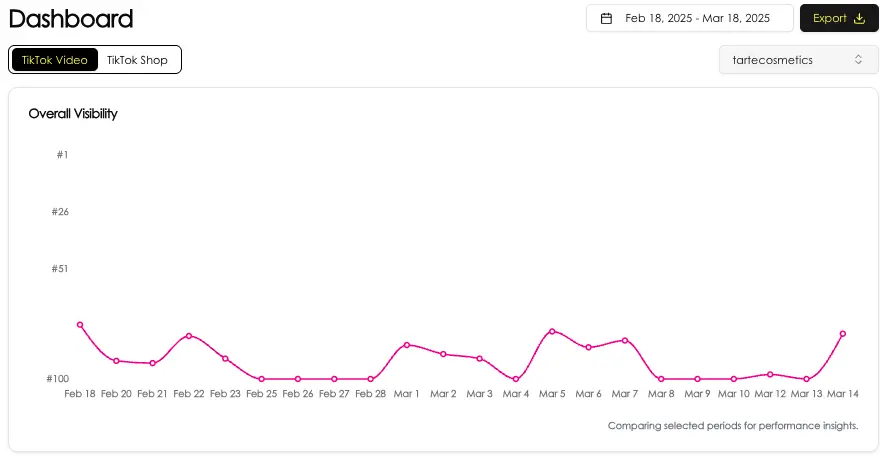
Example: Visibility trending upward (lower numbers) indicates improved rankings
Ranking Overview Table
This table provides detailed metrics for each keyword you're tracking:
- Keyword: The specific term being tracked
- URL/Product Title: The associated TikTok profile or product
- Rank: Current position in TikTok search results
- Period Change: How your ranking has changed during the selected timeframe
- Avg. Views: Average number of views for content ranking for this keyword
- Avg. Likes: Average number of likes for content ranking for this keyword
- Avg. Comments: Average number of comments for content ranking for this keyword
- Avg. Shares: Average number of shares for content ranking for this keyword
- Type: Indicates whether the content is "Owned" (your content) or from another source

Example: Ranking data for "best mascara", "mascara", "mascara tips" and "mascara for blue eyes" keywords